X Bot vs Manual Spreadsheet KOL Tracking: Why Bots Win on Volume
Manual KOL tracking works for 5 posts/week but breaks at 50. See what changes when a Telegram bot runs the fetch, score, and render loop for you.
 by Nacho Coll
Nacho leads the Blockchain Web Services (BWS) team that builds and operates X Bot — the Telegram bot that turns X (Twitter) activity into leaderboards for crypto communities.
If you’re tracking 2-3 KOLs posting 5-10 times per week, a Google Sheet works fine. You manually check their X profiles, copy engagement numbers, and build your own charts. Total cost: $0. Total time investment: maybe 30 minutes weekly.
But what happens when you’re managing 8 KOLs posting 50+ times per week? Or when you’re running a token launch campaign tracking mentions of $YOURTOKEN across dozens of accounts? The spreadsheet approach breaks down fast.
Here’s an honest comparison of manual KOL tracking versus automated bot tracking, including when each approach makes sense and the real costs involved.
The Spreadsheet Sweet Spot: Small Volume, Total Control#
Manual tracking in a spreadsheet has genuine advantages for small-scale KOL management:
Complete customization. You decide exactly which metrics matter, how to weight them, and what the final report looks like. Want to track “retweets from verified accounts only”? Easy to add that column.
Zero monthly fees. Google Sheets is free. Excel comes with Office. No subscription to worry about.
Deep context. When you’re manually reviewing every post, you understand the full story behind the numbers. That tweet with 500 likes might be controversial drama, not genuine engagement.
Perfect for 1-2 KOLs. If you’re a solo influencer tracking your own performance or an agency with just one client, spreadsheets are honestly hard to beat.
The typical workflow looks like this:
- Visit each KOL’s X profile
- Manually note new posts since last check
- Record likes, retweets, replies, views for each post
- Calculate weighted scores using your formula
- Update charts and send a weekly report
For 2 KOLs posting 3 times weekly, this takes maybe 20 minutes per week. Totally reasonable.
Where Spreadsheets Start Breaking Down#
The problems emerge when volume increases:
Manual Data Collection Becomes a Time Sink#
At 50 posts per week, you’re spending 2+ hours just copying numbers from X into your sheet. That’s before any analysis, reporting, or actual KOL management work.
Missing Data Gets Expensive#
Quote tweets are easy to miss when manually scanning profiles. So are deleted posts (which still matter for tracking). X’s algorithm also changes what you see in timelines versus direct profile visits.
One missed viral quote tweet can throw off your entire week’s scoring. When you’re paying KOLs based on performance, missing data costs real money.
Screenshot Fatigue#
Agency clients want visual proof, not just spreadsheet rows. You end up taking screenshots of top posts, cropping them, adding annotations, and building slide decks. This “reporting theater” often takes longer than the actual analysis.
Delayed Insights#
Most agencies check KOL performance once or twice weekly. By the time you spot an underperforming influencer or a viral breakout, the moment has passed. You can’t optimize mid-campaign when your data is 3-4 days stale.
How Automation Changes the Game#
X Bot handles the entire fetch → score → render loop automatically. Here’s what changes:
Real-Time Data Collection#
The bot checks X every few minutes for new posts matching your filters. It catches quote tweets, tracks deleted posts, and records engagement numbers as they evolve. No manual profile visits required.
Consistent Scoring Logic#
Your scoring formula runs identically every time. No “did I weight that retweet correctly?” doubts. No copy-paste errors. The bot applies your configured weights (likes, retweets, replies, quotes, views) uniformly across all posts.
Automatic Report Generation#
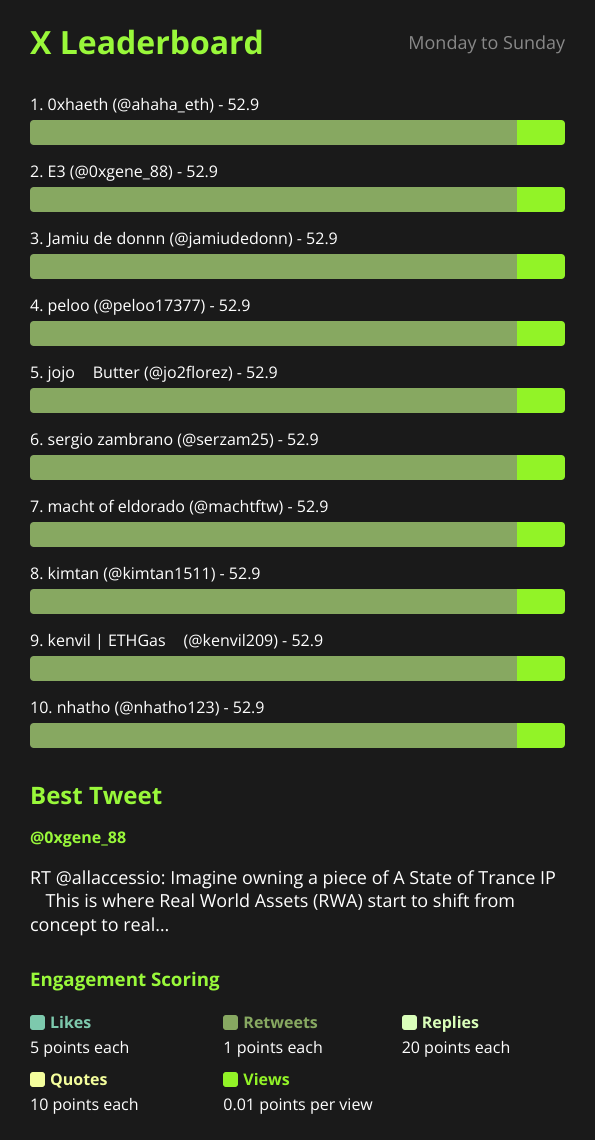
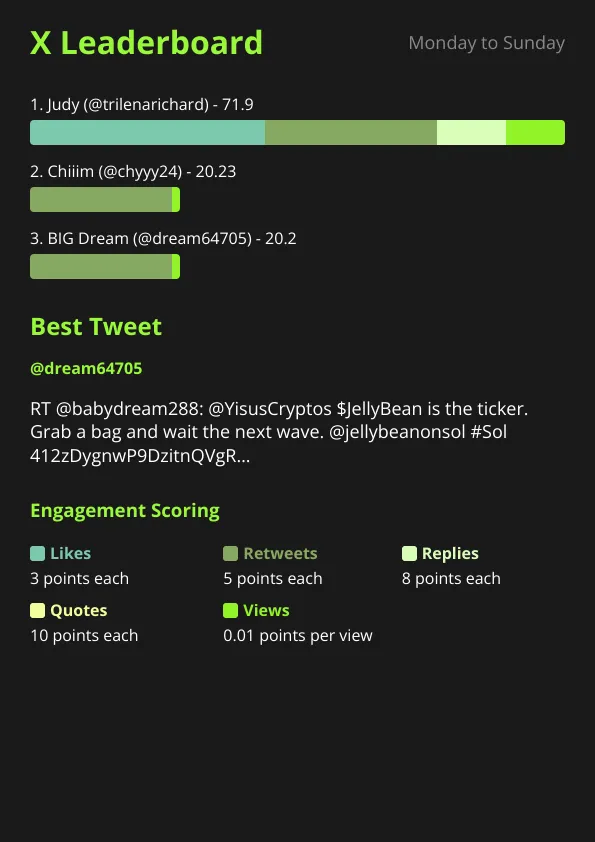
Instead of building charts and taking screenshots, the bot renders a complete leaderboard image showing:
- Top performers by total score
- The “best tweet” of the period
- Individual breakdown per user
- Your project branding (logo, colors, custom title)
The report lands directly in your Telegram group chat where the agency conversation is already happening.
Schedule Flexibility#
Daily reports at 09:00 UTC for morning standup? Done. Custom reporting every Tuesday/Thursday at 14:30? Also done. The bot supports preset schedules and custom cron expressions, firing automatically with a 12-hour minimum interval.
Volume Economics: When Automation Pays Off#
Let’s run the numbers on a realistic KOL agency scenario:
Small agency (2-3 KOLs, ~15 posts/week):
- Manual time: 30 minutes weekly = ~26 hours/year
- X Bot cost: FREE plan covers this volume easily
- Winner: Spreadsheet (unless you value the visual reports and real-time tracking)
Growing agency (5-8 KOLs, ~50 posts/week):
- Manual time: 2 hours weekly = ~104 hours/year
- X Bot cost: $19/month = $228/year for PRO subscription
- Winner: X Bot (saves ~100 hours annually vs $228 cost)
Large agency (10+ KOLs, 100+ posts/week):
- Manual time: 4+ hours weekly = ~200+ hours/year
- X Bot cost: $19/month + metered overages = ~$300-500/year
- Winner: X Bot (saves ~200 hours annually)
The crossover point is around 30-40 posts per week. Below that, spreadsheets are cost-effective. Above that, automation wins on pure time savings.
For the full breakdown of the FREE plan, PRO subscription, and ETH credit packs, see how X Bot pricing works.
Real Failure Modes We’ve Seen#
Here are actual problems agencies told us about with manual tracking:
“The intern forgot to check profiles over the weekend.” Monday morning, the client asks why KOL performance dropped 90%. Turns out the intern didn’t work Sunday, and two KOLs had viral threads that weren’t captured.
“Quote tweets are invisible.” Agency discovers a KOL’s thread was quote-tweeted by major crypto accounts, driving massive engagement. But quote tweets don’t show up in timeline scanning, so it never made the report.
“Screenshot chaos.” Agency spends more time cropping and annotating screenshot than analyzing performance. Client feedback: “Can you make the tweet images bigger? And add engagement numbers to each screenshot?”
“Excel formula broke.” Weighted scoring formula had a cell reference error for 3 weeks. Agency was inadvertently undervaluing retweets, leading to confused KOL payments and awkward correction emails.
When X Bot Is Still the Wrong Tool#
Automation isn’t always better:
Ultra-custom scoring needs. If you need to weight engagement differently based on follower count, time of day, or content sentiment, spreadsheets still give more flexibility.
One-off campaign tracking. For a 2-week campaign with 3 KOLs, the setup time for X Bot might exceed the manual work time.
Mixed platform tracking. If you’re tracking KOLs across X, Instagram, TikTok, and YouTube, you’ll need a spreadsheet anyway for the non-X platforms.
Compliance-heavy reporting. Some enterprise clients need audit trails, specific formatting, or integration with existing business intelligence tools that only custom spreadsheets can provide.
Getting Started: The Practical Path#
If you’re currently using spreadsheets and considering automation, here’s a low-risk approach:
Run both systems parallel for 2 weeks. Keep your existing spreadsheet workflow while testing X Bot on a subset of KOLs.
Compare time investment. Track how much time you spend on manual data collection versus X Bot setup and monitoring.
Evaluate report quality. Show both outputs to clients and get feedback on which format they prefer.
Check the volume math. If you’re tracking 25+ posts weekly, automation likely saves time even with the learning curve.
X Bot’s FREE plan covers 100 posts monthly, which is perfect for testing without any upfront cost.
For agencies managing multiple clients in a single chat, the bot’s “named filters” feature lets you track different KOL sets simultaneously while keeping everything in one dashboard.
The Reality: Most Agencies Use Both#
In practice, most successful agencies end up using automation for volume tracking and spreadsheets for deep-dive analysis. X Bot handles the daily “who’s performing well?” question, while custom spreadsheets dive deeper into trends, correlations, and client-specific metrics.
The bot also includes X Posts Auto-relay functionality, forwarding posts from selected accounts into your chat within ~5 minutes of publication. This bridges the gap between automated tracking and real-time engagement.
For token launch campaigns, the combination is especially powerful: automation tracks volume metrics across dozens of accounts, while manual analysis identifies which content themes and posting strategies drive genuine community growth.
Bottom Line: Volume Determines the Winner#
Manual tracking wins for small volume, high customization needs. Automated tracking wins for high volume, consistent reporting needs. The crossover is around 30-40 posts per week.
Most importantly, both approaches beat having no KOL performance data at all. Whether you choose spreadsheets or bots, the key is measuring consistently and optimizing based on real engagement data.
Ready to track your community on X? Add @BWS_X_Bot to your Telegram group, run /setup, and your first report fires on the configured schedule. The FREE plan covers 100 posts/month — no card required.
About this article: This post was drafted with AI assistance using X Bot’s content workflow and reviewed by Nacho Coll, Founder & Principal at Blockchain Web Services (BWS), before publishing. Every product claim is checked against the live bot. Read how we use AI in our content. Spot an error? Reach us via
/setup→ ❓ Help & Support.
About the author
Nacho Coll
Founder & Principal, Blockchain Web Services
Nacho leads the Blockchain Web Services (BWS) team that builds and operates X Bot — the Telegram bot that turns X (Twitter) activity into leaderboards for crypto communities. He writes about KOL performance tracking, the X API, and running analytics bots for Telegram groups, from the operator side of the wire. Building on blockchain and decentralized infrastructure since 2019.
- kol tracking spreadsheet
- x analytics manual vs automated
- kol management spreadsheet alternative