How to Read Your X Bot Leaderboard Report: Scores, Ranks and Best Tweet
A plain-English walkthrough of an X Bot report image: how each user score is built, what the ranking means, and the questions to ask before acting on it.
 by Nacho Coll
Nacho leads the Blockchain Web Services (BWS) team that builds and operates X Bot — the Telegram bot that turns X (Twitter) activity into leaderboards for crypto communities.
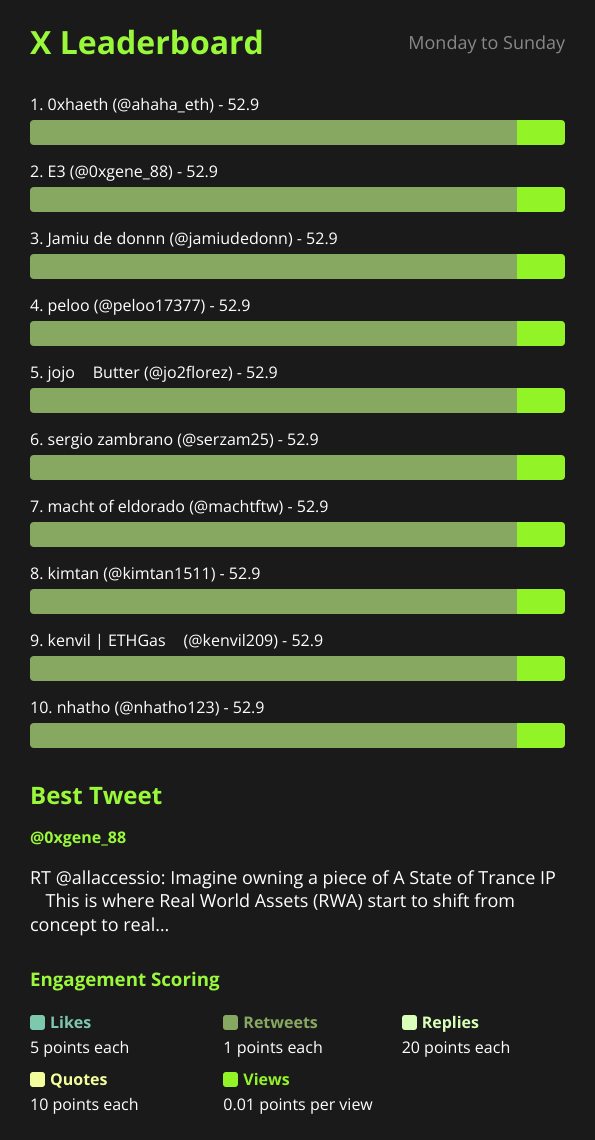
The first X Bot report lands in your Telegram group and someone asks the obvious question: “OK, but what does 1,284 actually mean?” If you manage a community, run an agency, or just got added to the chat by a colleague, you can look at the image and still not be sure how the numbers were produced or how far to trust them.
This article is a reading guide. It walks through the report image section by section, shows exactly how a user’s score is calculated (with the arithmetic done out), and lists the questions worth asking before you reward, pay, or criticise anyone based on what the report says.
What a report is, in one paragraph#
On the schedule you configured, X Bot fetches the X posts that match your filters for the current period, scores each tracked account, renders a leaderboard image on the server, and posts it into the chat. The image is the product. Everything below is about what is inside it.
Section 1: the leaderboard title#
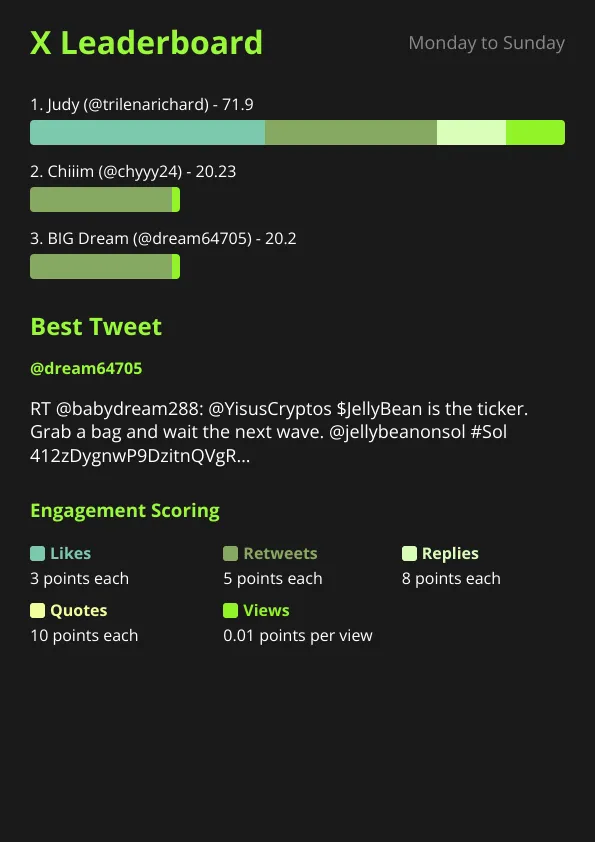
At the top of the image is the leaderboard title. By default it reads X Leaderboard, in the default green. This is pure branding: you can change the text and color from /setup → 🎨 Customization, and agencies commonly replace it with a client’s campaign name. It has no effect on the scores.
The same applies to the two other section headings in the image. The best tweet block defaults to Best Tweet, and the scoring block defaults to Engagement Scoring. If a heading looks odd to you, someone on the admin team probably customised it on purpose. See white-labeling X Bot reports for client delivery for how agencies use this.
Section 2: the ranked list#
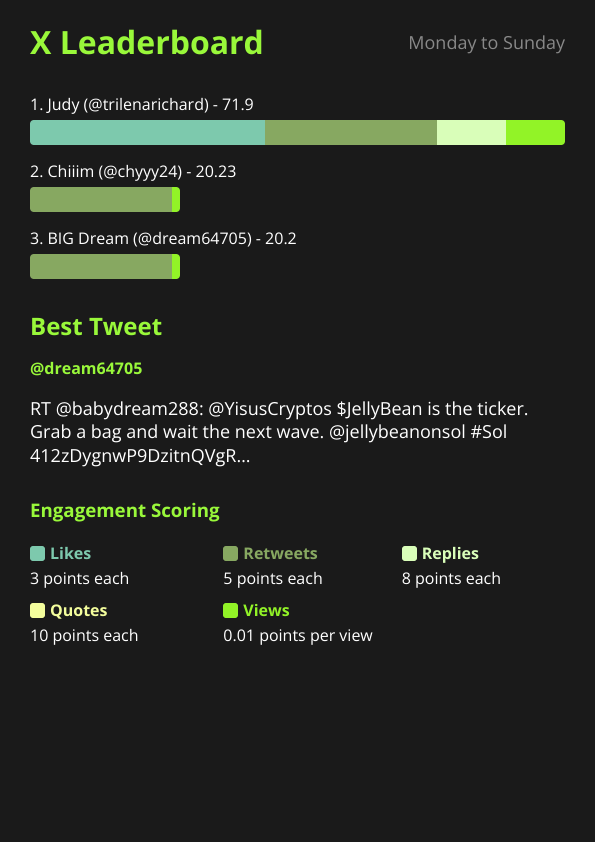
Below the title is the ranked list of accounts, highest score first. Two things to know:
- The list is capped. Only the top N accounts are shown, and N is a setting:
/setup→ 🎨 Customization → 🔢 Top count accepts a number from 1 to 10. If you track 40 accounts and see far fewer, nothing is broken; the cap is doing its job. Check the value shown on that screen rather than assuming a default. - Ranking is purely by total score. There is no tie-breaking by recency, follower count, or post quality. Higher number, higher position.
Each row represents one X account (a handle) for the report period, not one post. If an account posted six times in the period, all six posts are added into that single row.
How a user’s score is built#
This is the part people most often get wrong, so here is the actual formula. For each account, X Bot totals the metrics across all of that account’s matching posts in the period, then computes:
score = 10
      + (likes    x likes weight)
      + (retweets x retweets weight)
      + (replies  x replies weight)
      + (quotes   x quotes weight)
      + (views    x views weight)
The 10 is a flat base score for the account having posted at least once in the period. It is added once per account, not once per post, so posting more often does not stack it.
The default weights are:
| Metric | Default weight |
|---|---|
| Likes | 3 |
| Retweets | 5 |
| Replies | 8 |
| Quotes | 10 |
| Views | 0.01 |
Notice the ordering. Quotes and replies are worth the most, retweets sit in the middle, likes are cheap, and views are close to nothing. That is deliberate: a conversation is harder to fake than a passive impression. If you disagree with that philosophy for your community, customizing leaderboard score weights covers how to change it.
A worked example#
Say one account, across all its matching posts in the period, collected:
- 4 likes
- 2 retweets
- 1 reply
- 1 quote
- 1,000 views
With default weights:
| Part | Calculation | Points |
|---|---|---|
| Base | flat | 10 |
| Likes | 4 x 3 | 12 |
| Retweets | 2 x 5 | 10 |
| Replies | 1 x 8 | 8 |
| Quotes | 1 x 10 | 10 |
| Views | 1,000 x 0.01 | 10 |
| Total | 60 |
Now compare a second account with 10 likes, nothing else, and 200 views: 10 + 30 + 2 = 42. The first account wins despite far fewer total interactions, because its interactions were the higher-value kind.
Once you can do this sum for one row, you can sanity-check every other row in the image. If a number looks implausible, the likely explanations are a custom weight set (check /set_points or /setup → 🎨 Customization), or a filter that is pulling in more posts than you expected.
Section 3: the best tweet#
Separate from the ranking, the report highlights one post from the period as the best tweet. It is chosen on its own criteria and is not simply the highest-scoring post, so it can differ from what the numbers would suggest. It is the part people screenshot and forward.
The full selection rule is explained in how the best tweet picker works. The short version for reading a report: treat it as an editorial highlight, not a second leaderboard.
Section 4: the scoring explanation#
The final block, headed Engagement Scoring by default, tells readers how points were awarded. This matters more than it looks. When a leaderboard is visible to a whole community, people will ask why they ranked where they did, and a visible scoring key answers that before it becomes an argument. If you changed the weights, this block is how members learn the new rules.
The text that can accompany the image#
Depending on your setup, the image may arrive with a short written summary that calls out the standout posts of the period. Treat that text as commentary on the image, not as a separate source of truth. The image and its scores are the record.
A quick routine for reviewing each report#
Teams that get value from the report tend to follow the same short routine every time it lands. First, glance at the top three rows and ask whether the order matches your own sense of who has been active. If it does, the report confirms what you already believed and you can move on. If it does not, open the underlying posts for the surprising row before saying anything in the chat. Second, read the best tweet and decide whether it is something you would want to repost or pin. Third, note any account that dropped out of the list entirely, because a missing handle is usually a filter or posting-gap issue worth a quick check, not a scoring bug. Five minutes of this each week beats an hour of arguing about a number later. If the report covers your own staff, the tone matters as much as the numbers; team advocacy on X covers how to run it.
Five questions to ask before acting on a report#
Reading the numbers is the easy half. Using them responsibly is the harder half.
- Is this engagement or quality? The score measures reactions, not whether the post was accurate, on-brief, or good. A provocative post can outscore a thoughtful one.
- Is the period what I think it is? A daily report covers a different window than a weekly or fixed-date one. Check the period before comparing two reports. Fixed-date setups are covered in running a fixed-dates engagement contest.
- Are the filters catching the right posts? An account missing from the list may simply not match your filters. An unexpectedly high row may be matching posts you did not intend. If a report looks empty or odd, the match ANY vs ALL explainer is the first stop.
- Is noise inflating anyone? Retweets, quotes and replies can be excluded, and known bad actors can go on the ignore list. See cleaning up noisy X Bot reports.
- Do I need proof, not a score? If money is attached to a deliverable, use the report as a starting point and verify the underlying posts yourself.
When this report is the wrong tool#
Be honest about the limits. X Bot gives you a consistent, repeatable ranking of engagement on matching posts. It does not judge sentiment, detect coordinated engagement farming, or tell you whether a post drove sales or sign-ups. If those are the questions you need answered, use the report as one input among several, not the verdict.
For the full menu reference, see the setup menu documentation, and for a product overview the X Bot overview.
Ready to track your community on X? Add @BWS_X_Bot to your Telegram group, run /setup, and your first report fires on the configured schedule. The FREE plan covers 100 posts/month — no card required.
About this article: This post was drafted with AI assistance using X Bot’s content workflow and reviewed by Nacho Coll, Founder & Principal at Blockchain Web Services (BWS), before publishing. Every product claim is checked against the live bot. Read how we use AI in our content. Spot an error? Reach us via
/setup→ ❓ Help & Support.
About the author
Nacho Coll
Founder & Principal, Blockchain Web Services
Nacho leads the Blockchain Web Services (BWS) team that builds and operates X Bot — the Telegram bot that turns X (Twitter) activity into leaderboards for crypto communities. He writes about KOL performance tracking, the X API, and running analytics bots for Telegram groups, from the operator side of the wire. Building on blockchain and decentralized infrastructure since 2019.
- x bot leaderboard report
- read kol leaderboard
- engagement score explained
- telegram x report meaning